So, you are looking at the screen, seeing red and green numbers flashing, and wondering what on earth is happening to the Bitcoin price.
I’ve been staring at these charts since the 2017 bull run, and honestly, it’s never really gotten any less stressful.
It’s a total rollercoaster.
Most people look at the price and see a number.
But if you want to actually understand what’s going on, you have to look deeper.
From what I’ve seen, the difference between a trader who loses money and one who makes a profit usually comes down to understanding how to read a chart rather than just guessing where the price is going.
Now think about that for a second.
It’s not just about buying low and selling high. But there’s a catch.
It’s about context.
Let’s break down what is actually driving the value of Bitcoin right now and how you can stop feeling like you’re flying blind.
Why is the BTC price so volatile anyway?
Let’s get this out of the way first: Bitcoin is volatile.
That is the fancy word for “it moves a lot.” Sometimes it goes up 10% in a day, and other times it dumps 15% in an hour.
But why?
- Hype and News: Any time the President of the US tweets about crypto, or a big bank announces something, the price spikes.
It’s an emotional market.
- Supply and Demand: There is a hard limit of 21 million coins.
If everyone wants them at the same time, the price has nowhere to go but up.
- Market Sentiment: This is the “Fear and Greed Index” I mentioned.
When people are scared, they sell (price drops).
When they are greedy, they buy (price rises).
Here’s the interesting part.
At the moment of writing, we are seeing a lot of movement based on ETF approval news.
It’s wild.
Oddly enough,
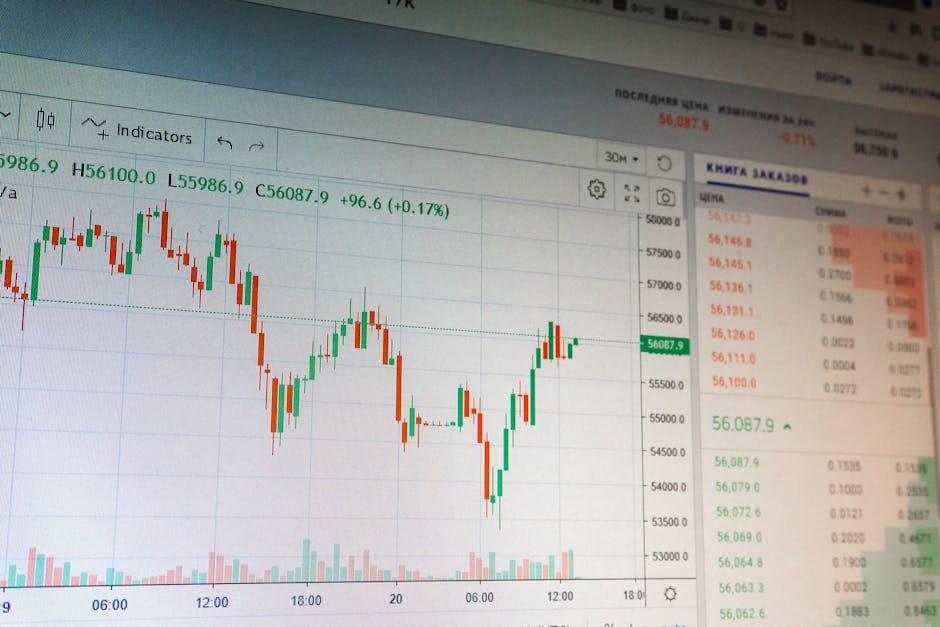
Reading the Chart: Candlesticks 101
You don’t need to be a math genius to read candlestick charts, but you do need to learn the basics. Here’s the interesting part.
Think of a candle as a history of a specific time period (like one hour or one day).
- The Body: The thick middle part shows the opening and closing price.
If it’s green, the price went up.
If it’s red, it went down.
- The Wick: The lines sticking out top and bottom show the highest and lowest price reached during that time.
I still mess this up sometimes.
I look at a candle and forget that the wick is just the price trying to break through but failing.
It tells you about resistance levels.
If a candle keeps hitting the top wick but can’t close above it, that’s a signal.
Support and Resistance
This is where most beginners trip up. Now think about that for a second.
Support is like a floor.
It’s a price level where people stop selling because it’s “cheap.” Resistance is the ceiling.
It’s a price level where people stop buying because they think it’s “expensive.”
If the price bounces off the support level a few times, traders start calling it a “strong support zone.” That is a good place to look for buy signals, provided your risk management is on point.
What’s Really Driving the Current BTC Price?
Looking past the charts, there are three big things moving the needle right now.
The Halving Effect
Every four years, the number of new Bitcoin created is cut in half.
This happened in 2024.
Supply gets tighter, but demand usually hasn’t caught up yet.
This usually leads to a massive price surge months later. But there’s a catch.
Most analysts are watching this cycle very closely.
Spot ETFs
Remember when I said big banks matter? Well, spot ETFs allow regular people (and funds) to buy Bitcoin directly on the stock market.
This has brought a ton of institutional money into the game.
It makes the market less volatile in some ways, but more influenced by macro-economic news.
Common Mistakes Beginners Make with the Price
It feels good to be right, but trying to time the market is usually a mistake.
Here are a few traps I see people falling into:
- Chasing the dip: Buying just because the price is “lower” than it was yesterday.
If the trend is down, don’t buy.
- FOMO: Buying at the absolute top because everyone else is talking about it on Twitter.
That is pure panic buying.
- Ignoring the news: Thinking technical analysis is the only thing that matters.
Regulatory news in places like Europe or the US can crash the price overnight.
Where to Start Tracking the Price
There are a million websites out there, but honestly, you only need a couple.
Look for sites that show not just the price, but the 24-hour volume.
Volume tells you if a price move is real or just a trick.
But there’s a catch.
For a beginner, I’d suggest looking at reputable crypto exchanges first because the charts are user-friendly.
If you are serious, then look at tradingview.com, but be careful, it’s complicated.
Final Thoughts
Look, nobody can predict the Bitcoin price with 100% accuracy.
Even the smartest people in the room get it wrong.
The goal isn’t to get rich overnight; it’s to understand the mechanism behind the money.
Here’s the interesting part.
So next time you see the price swing, don’t just panic.
Look at the candles.
Check the volume.
And remember, it’s just a tool.
You are the pilot.
If you are thinking about getting started and want to see the current market in real-time, checking a live BTC price chart is the first step.
Image source: pexels.com
Image source credit: pexels.com